
Crafting Powerful Reporting Dashboards with GA_Universe
Crafting Powerful Reporting Dashboards with GA_Universe
In the expansive world of application development, a standout feature for businesses and developers is the creation of reporting dashboards. These dashboards are crucial for visualizing data, tracking metrics, and deriving insightful analytics. GA_Universe simplifies this process, allowing users to effortlessly create robust and intuitive reporting dashboards. Let’s embark on the journey of building your next reporting solution using our advanced platform.
Simple Reporting Made Easy
The Simplified Reporting Control Element further enhances GA_Universe’s reporting capabilities. This tool revolutionizes report creation, allowing users to generate a variety of charts with ease. Its drag-and-drop functionality and extensive customization options enable the creation of reports that meet diverse analytical requirements, highlighting GA_Universe's dedication to user-friendly and powerful data visualization tools.
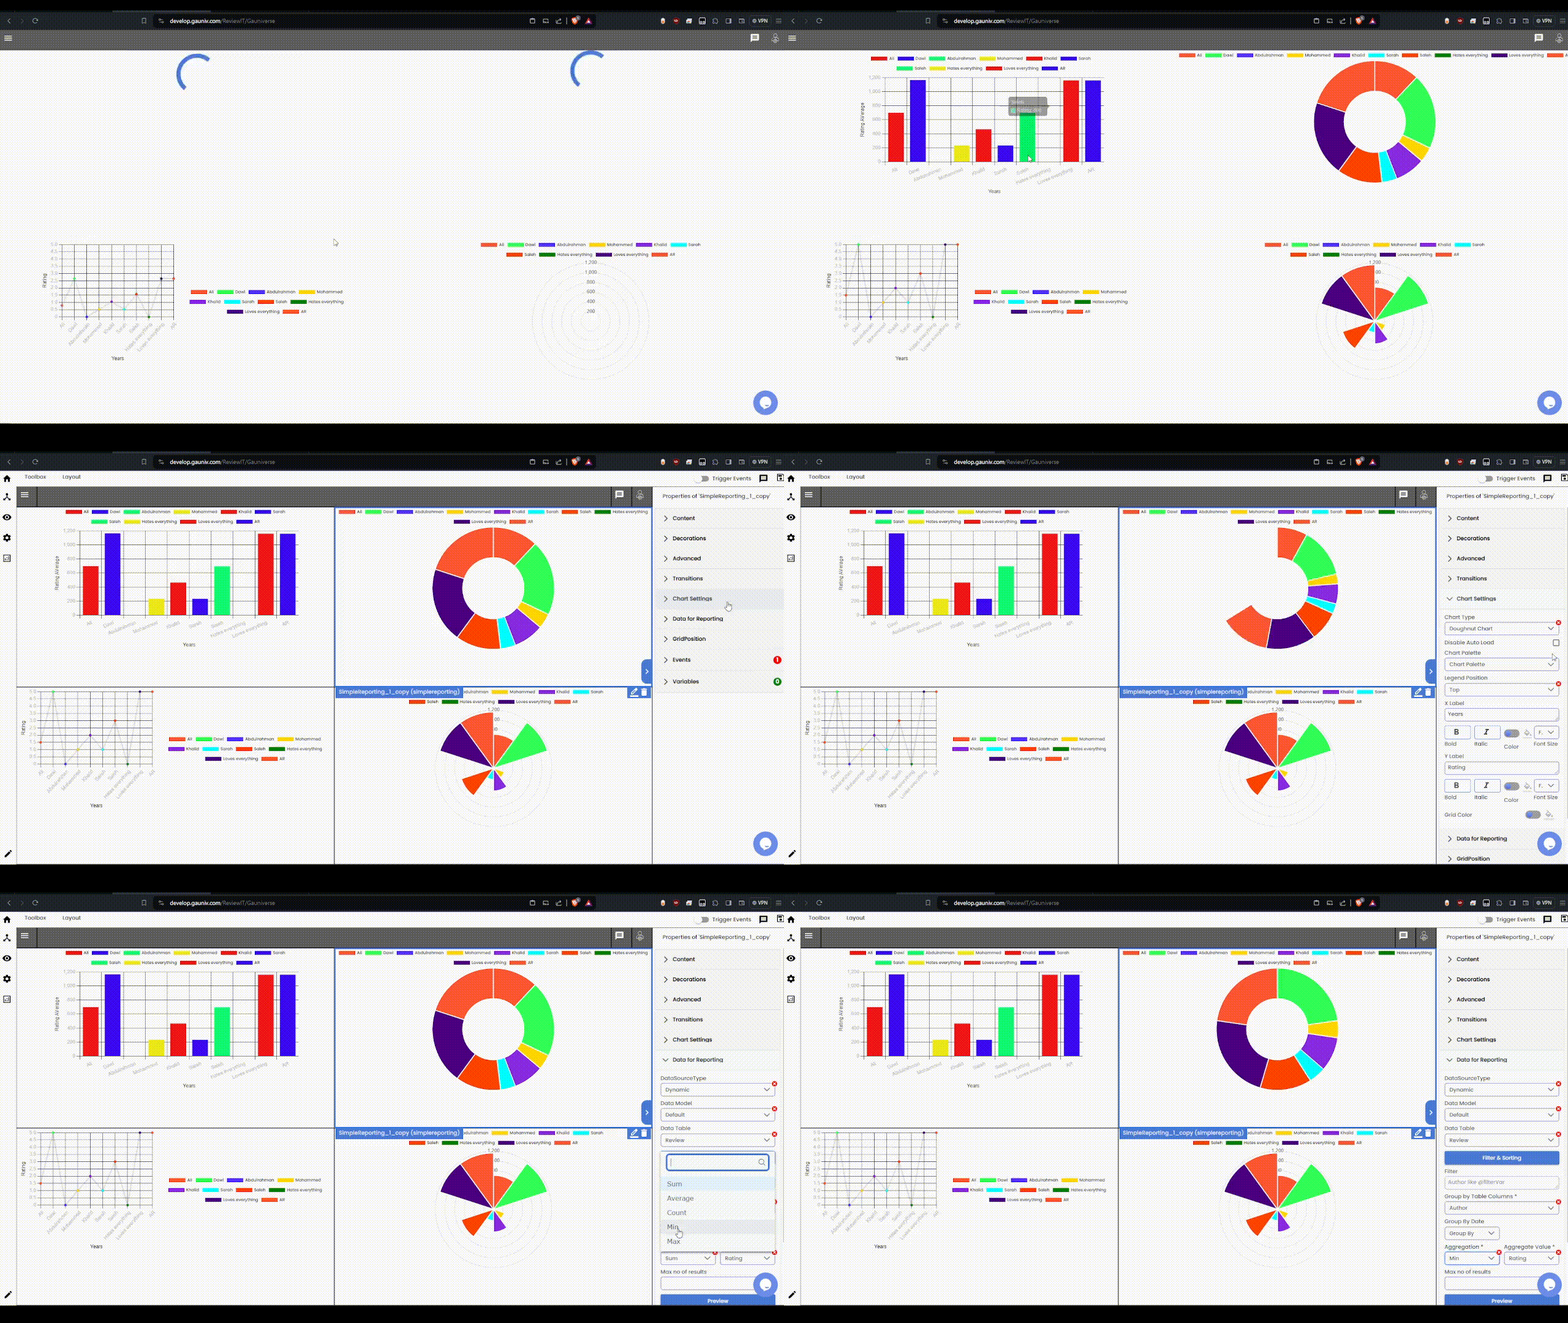
Reporting in GA
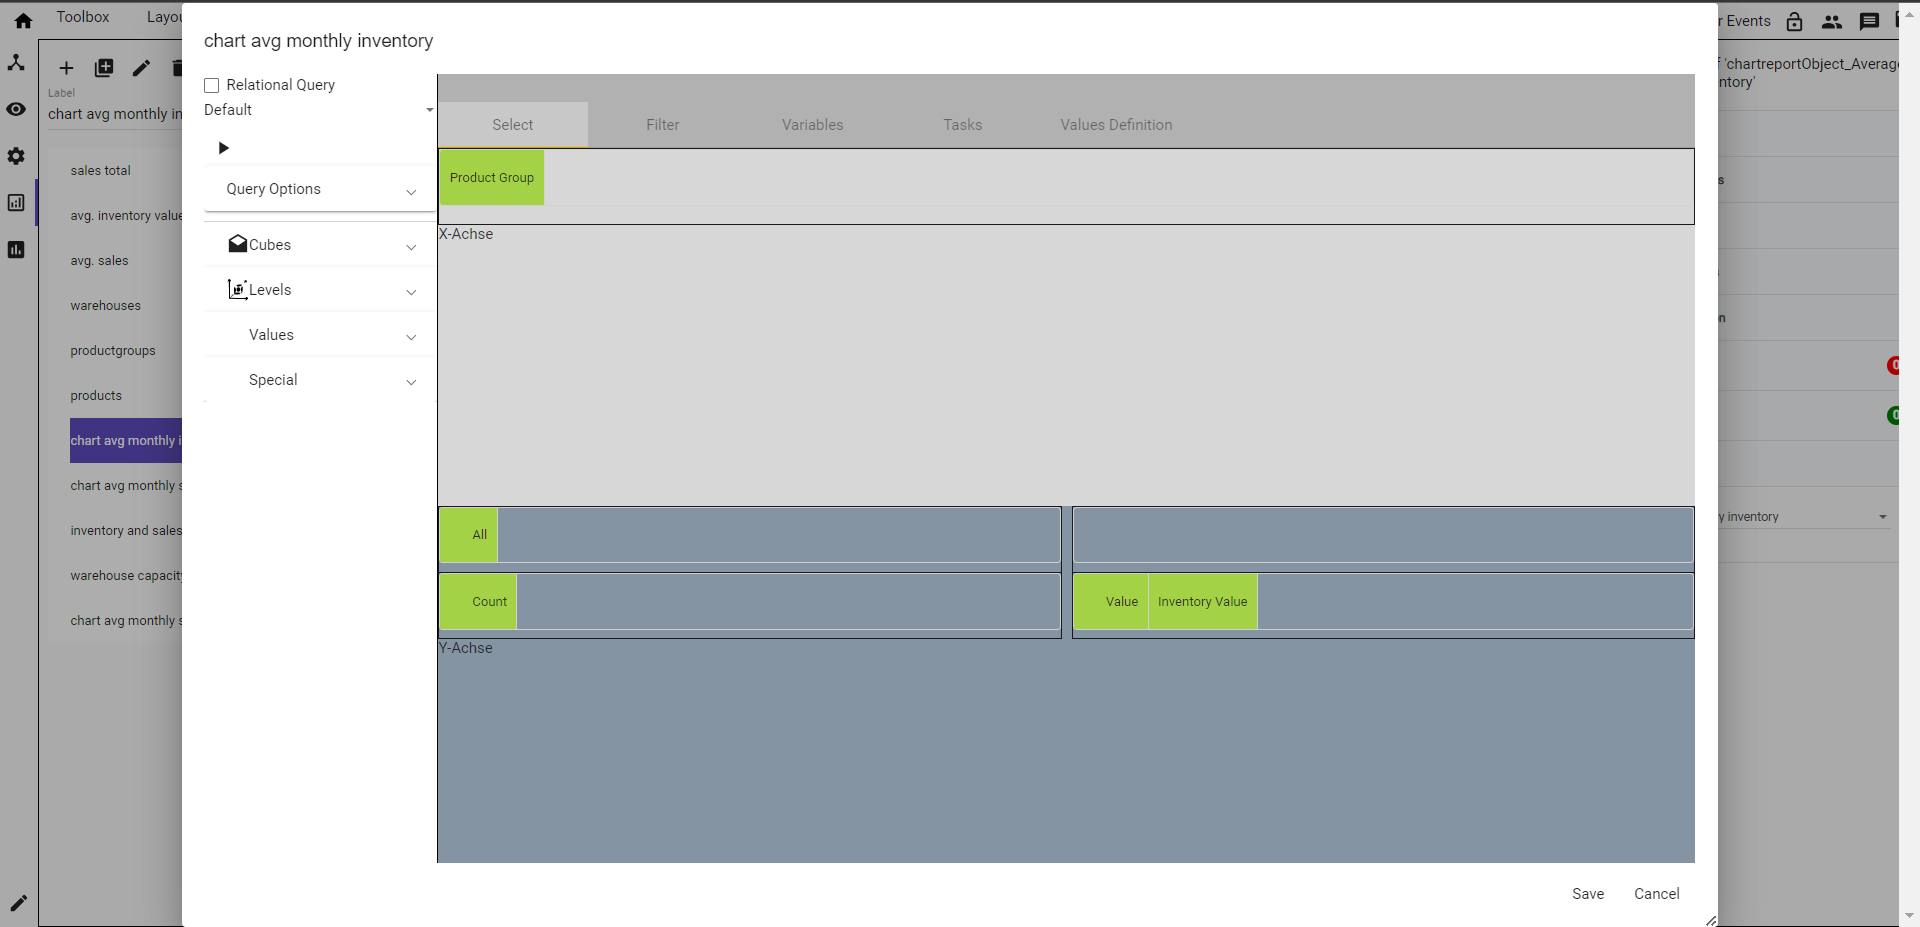
GA_Universe reporting Dashboard
GA_Universe Reporting Dashboard
At the heart of GA_Universe's reporting capabilities is our dynamic tool, the Data Visualizer. This versatile feature enables both complex and straightforward report creation, seamlessly pulling and analyzing data from various sources. Its flexibility allows users to visualize data across different timeframes and categories, offering a comprehensive view of the data landscape.
Designing Your Reporting Dashboard
The process of creating your dashboard in GA_Universe is user-friendly and efficient. Our low-code approach, featuring drag-and-drop functionality and intuitive design controls, makes it easy to craft the perfect dashboard to suit your specific needs.
From simple tables to complex graphs, our platform accommodates all types of reports. Whether you require a basic table of monthly sales or a more complex multi-dimensional graph to compare growth across products, GA_Universe has the tools to support your objectives.
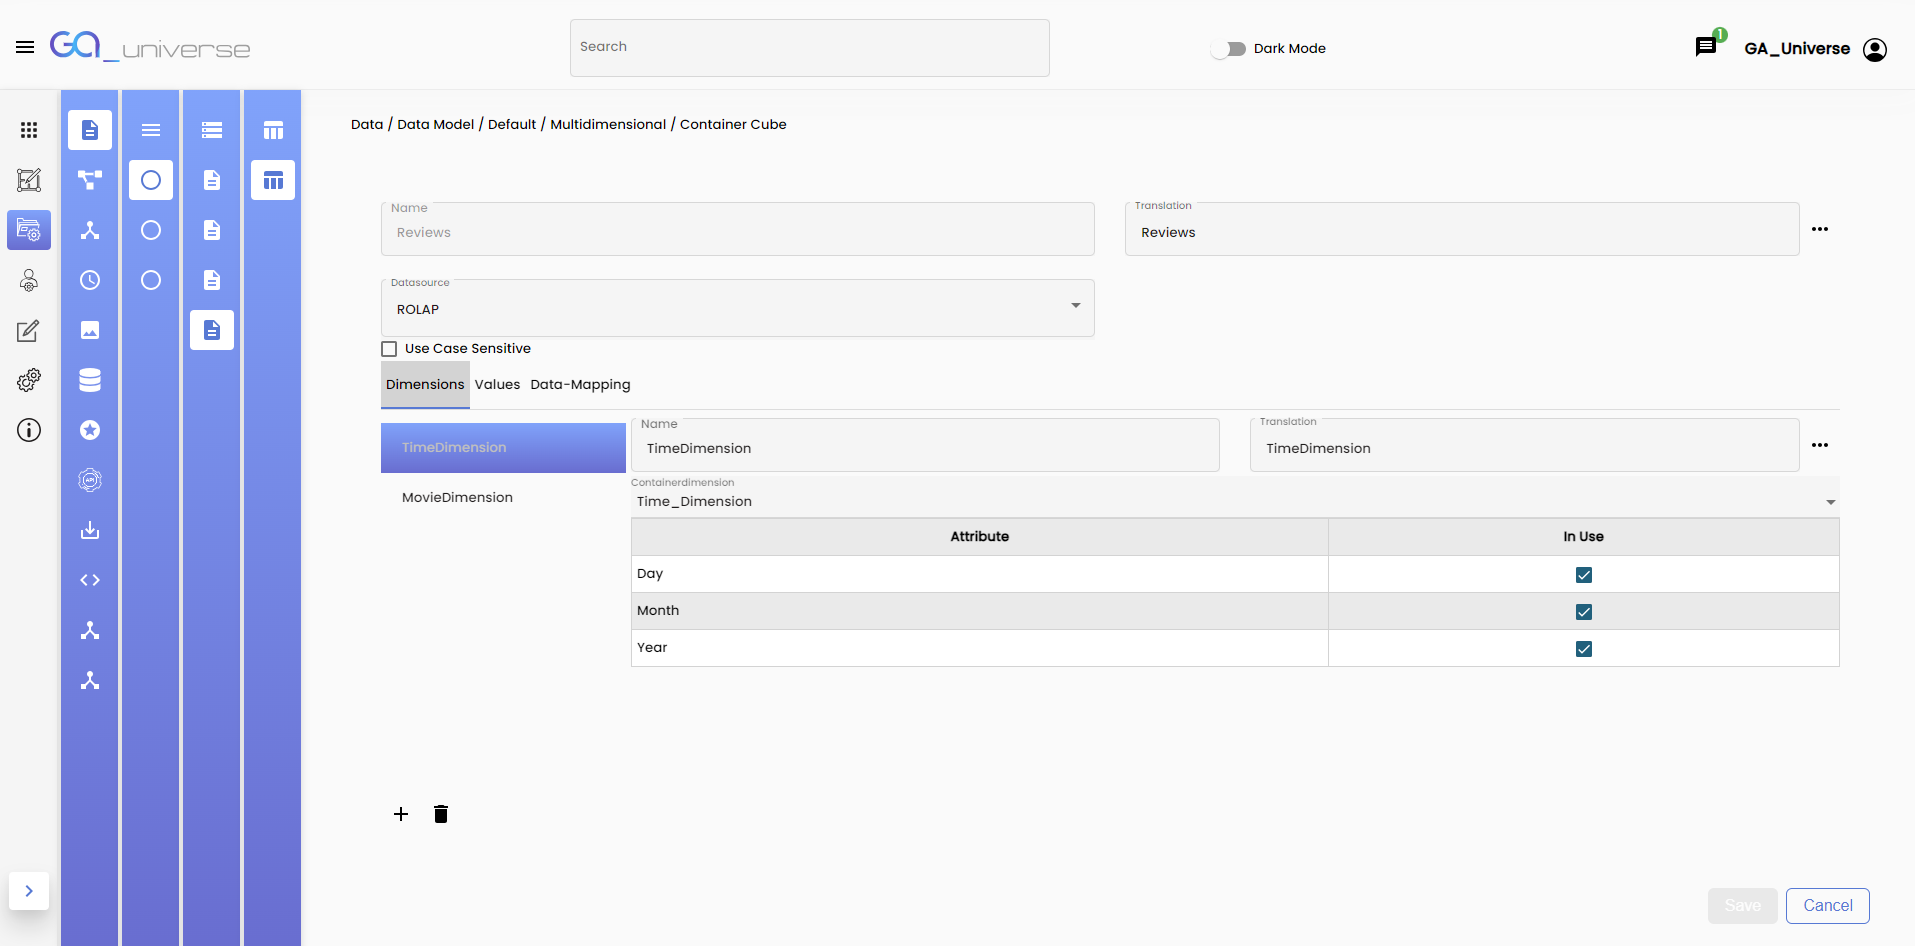
ROLAP Cube in GA_Universe
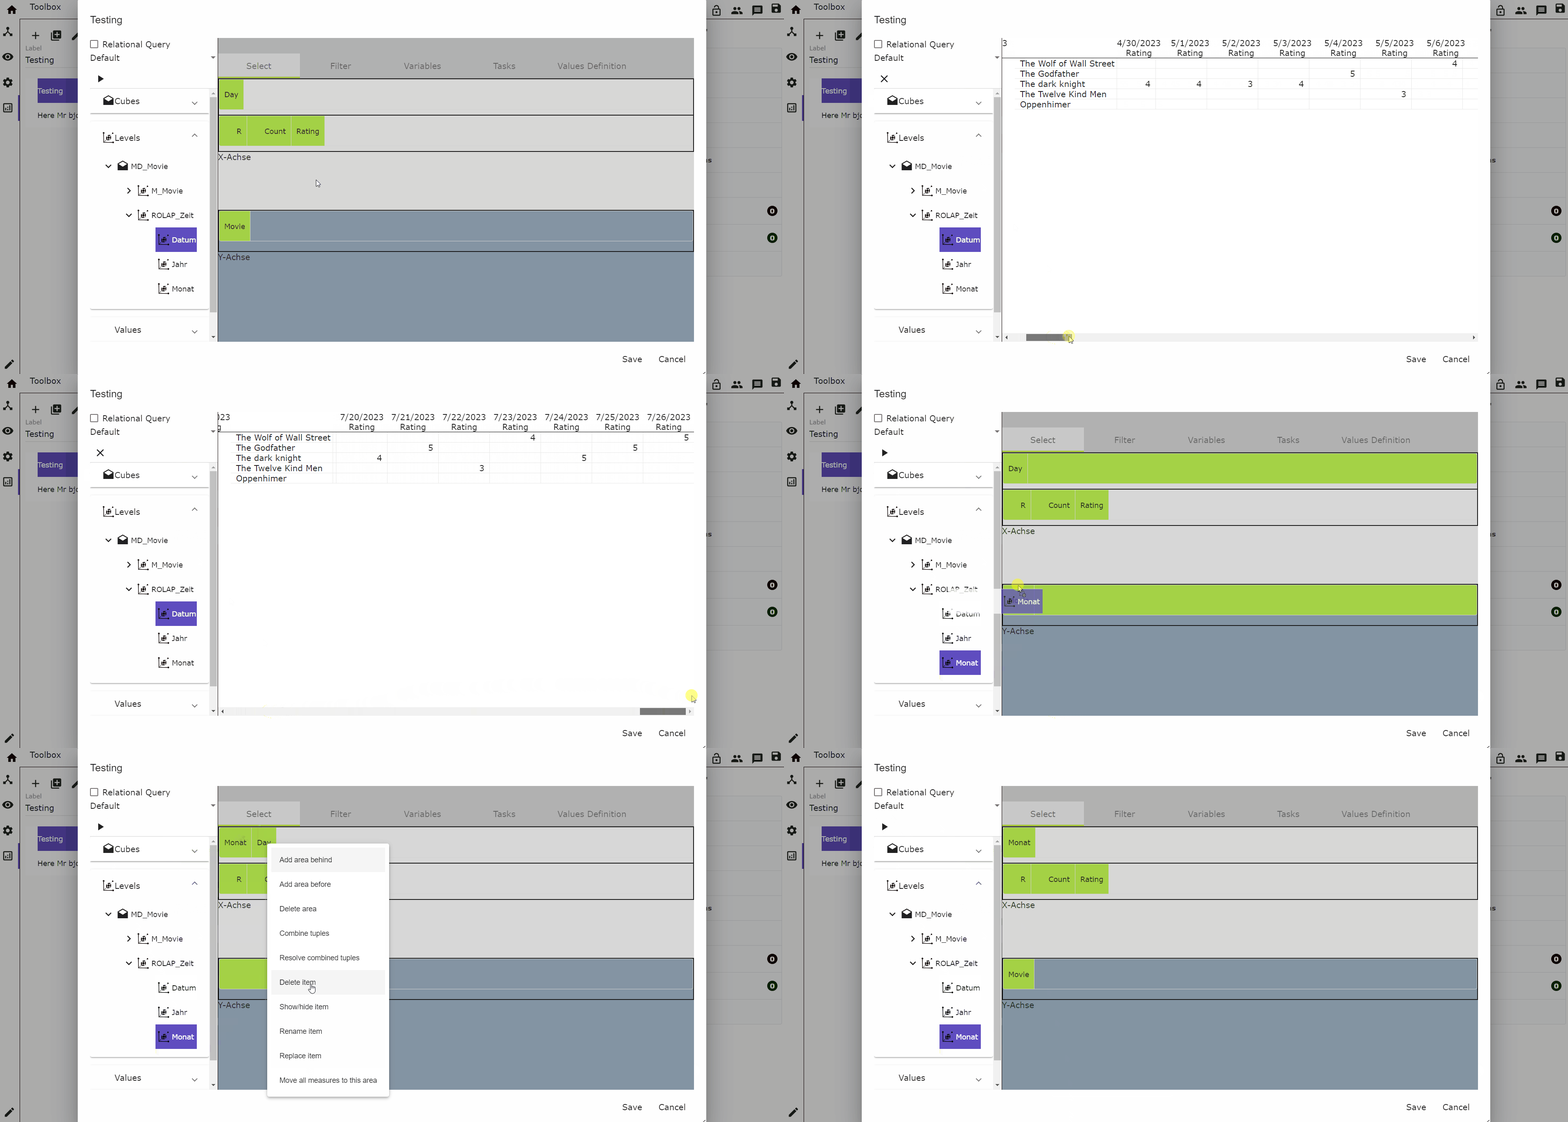
Reporting dashboard in GA
Dive Deeper with Advanced Analytics
GA_Universe goes beyond basic visual representation, enabling deep dive analytics to uncover patterns, anomalies, and actionable insights within your dashboard. The customizable queries feature allows users to tailor their analysis to specific needs, offering unmatched flexibility in data exploration.
Sharing and Updates
Effortless Sharing
Once your report is ready, sharing it with stakeholders is a seamless process. Be it within your team or with external partners, ensure everyone stays in the loop.
Real-time Updates
When using GA, all reports are updated automatically when new data is inserted into the tables, making real time updates much easier!
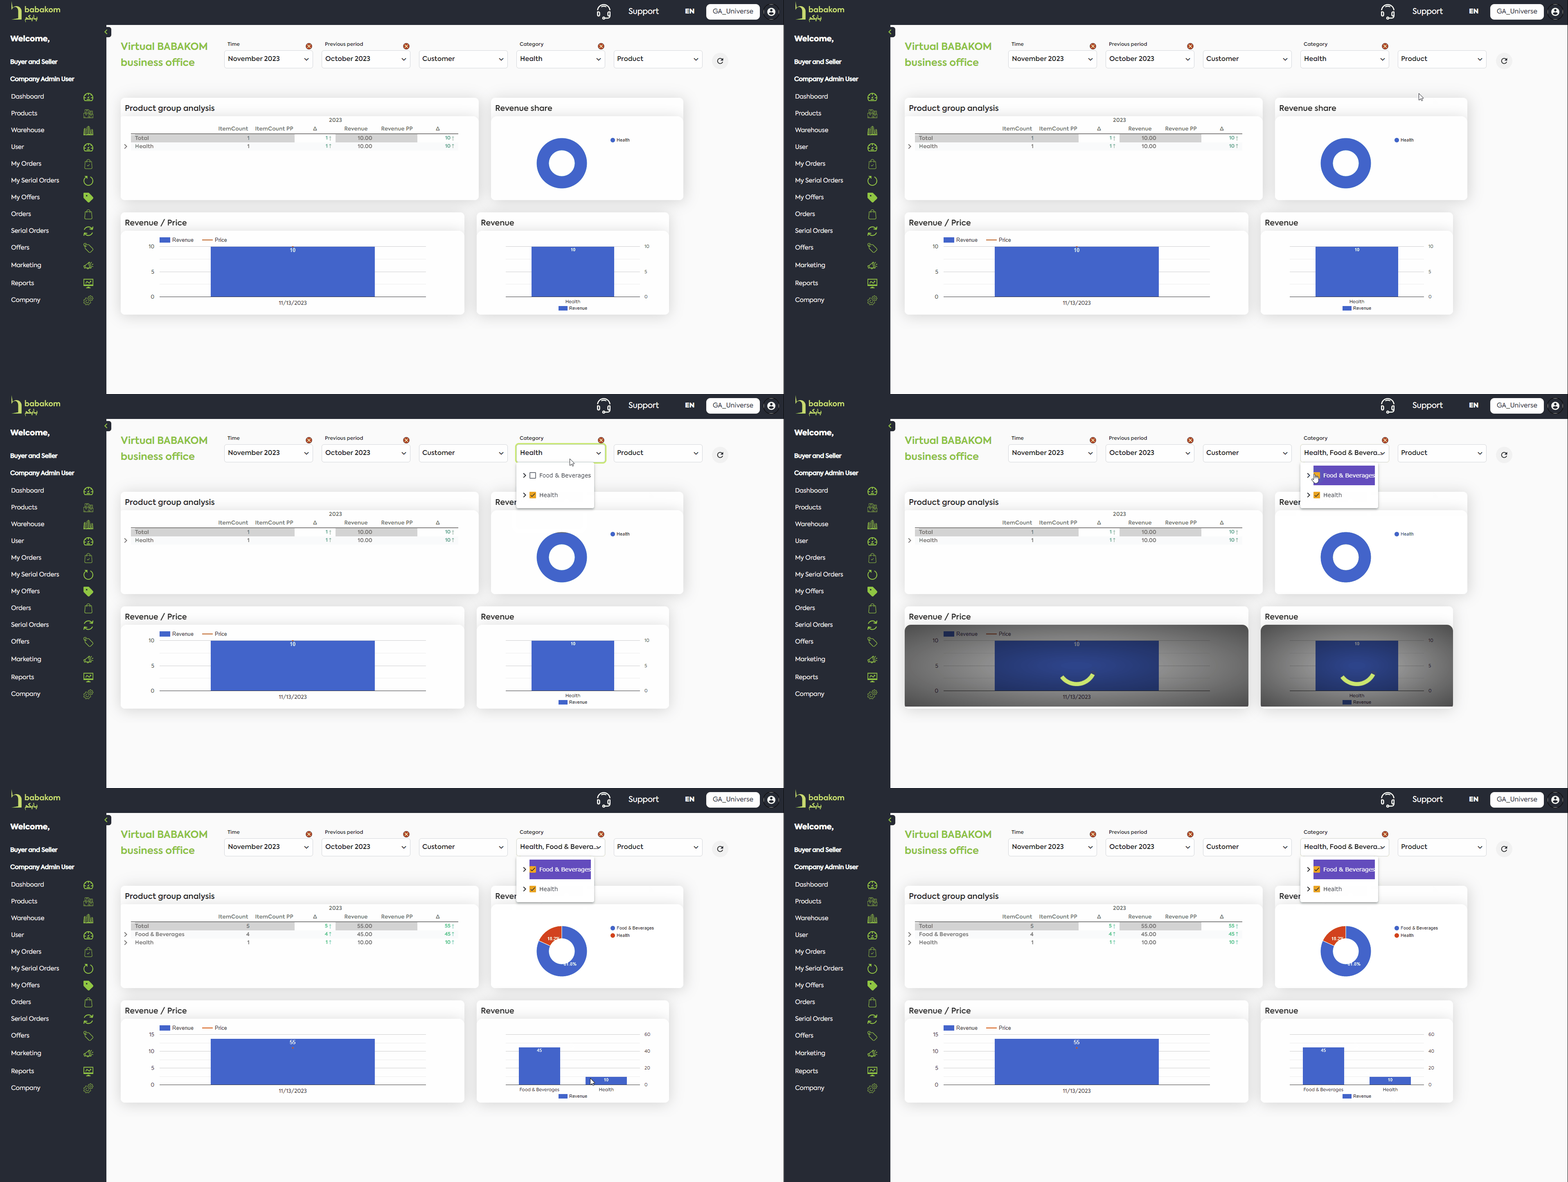
Advanced reporting in GA
Get Started Today
GA_Universe is revolutionizing the realm of reporting dashboards. With its user-centric design, powerful ROLAP cube functionality, and advanced analytics capabilities, creating insightful dashboards has never been easier.
Dive in today and transform the way you visualize and interpret data!
